2 December 2021

Project crashing is the process of compressing a project plan by using additional resources to reduce the duration of some tasks.
Using additional resources incurs additional cost, so it is important that the resources are deployed to the tasks that produce the greatest benefit. A project manager must decide an appropriate trade-off between time and cost for each task, leading to the best revised project plan. Given the dependencies between project tasks, making these trade-offs can be complex and difficult, even for a small project.
This article describes an example of project crashing using an optimization model to help the project manager decide what to do.
Download the model
The model is available on GitHub.
Situation
We have a baseline project plan, as shown in the Figure 1 Gantt chart. The project consists of 15 tasks, with durations that range from 1 day to 20 days per task. Given the interactions between tasks, especially the dependency requirements, the baseline project plan has an overall duration of 65 days.
The baseline plan has the shortest possible overall duration, given the baseline resources, the ability to complete some tasks in parallel, and the critical path (shown in red).
Note that the last task, "Time reduction", is a dummy task that indicates the difference between the baseline plan and the current plan. Since Figure 1 shows the Baseline plan, the "Time reduction" task has zero duration.
Most tasks can be completed faster by deploying additional resources, which incurs additional cost. Our objective is to find, for a specified project duration, a revised project plan that has the lowest possible cost (including both the normal costs and the cost of additional resources).
For example, suppose we want to reduce the overall project duration by one day, to 64 days. We note that the "Design" task is on the critical path, and we can reduce its duration cheaply. In the baseline plan, the "Design" task takes 9 days. By using additional resources, we can reduce the duration to 4 days (or anywhere in between, in whole days). As a result of reducing the "Design" task's duration, its dependencies (the "Build" and "Revision" tasks) can start earlier, as can their dependencies. So, if we reduce the "Design" task by one day, then the whole project will be completed one day earlier, as required.
We can also reduce the duration of the "Test design" task. But, because the "Test design" task isn't on the critical path, reducing its duration does not reduce the overall project's duration. Therefore, there's no benefit to making that change, at least in isolation, as it doesn't help us achieve our goal of reducing the overall project duration by one day.
The difficult aspect of project crashing is that combinations of changes can be beneficial. For example, if we reduce the duration of some tasks on the critical path, we may create additional critical paths. To further reduce the overall project duration, we typically need to reduce the duration of multiple tasks simultaneously, considering their respective and combined additional costs.
Juggling the potentially numerous interactions across the project plan's tasks is a tricky process to do manually. That's where an optimization model can be useful.
Model design
Model formulation
Our model formulation, as shown in Figure 2, is based on the paper "Project crashing using Excel Solver: A simple AON network approach".
That is:
- Equation (1). We want to minimize the total project cost (note that the normal project cost is constant).
- Equation (2). Limit on task reduction.
- Equation (3). Reduced task duration, for each path through the project plan.
- Equation (4). Reduction in task duration (days).
Define all possible paths
A central component of this formulation is that we need to define all potential paths through the project plan. We then calculate the duration of those paths, as defined in Equation (3). For example, looking at the project plan in Figure 1, we can identify some paths as follows:
- Path 1: Engagement → Requirements → Specification → Approval → Deployment.
- Path 2: Engagement → Requirements → Revision → Approval → Deployment.
- Path 3: Engagement → Requirements → Revision → User training → Deployment.
That is, we define a path by following the arrows between tasks in the project plan. In total, this project has 11 paths through the plan. For a larger project, we may want to create an automated method for identifying all potential paths through the project plan.
Implementation

Specify the task data
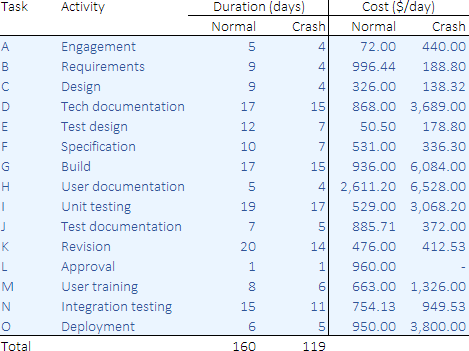
We start by defining the data for each task, as shown in Figure 3.
Each of the 15 tasks has a short name, from "A" to "O", for easy reference. Each task also has a normal duration, as used in the baseline project plan, and the minimum possible crash duration. A cost per day is associated with the normal and crash durations for each task.
For example, "Task A (Engagement)" normally takes 5 days at a cost of $72/day. We can reduce the duration of "Task A" to 4 days, at a cost of $440 for each day of reduction.
Some tasks are relatively cheap to reduce, while others are very expensive. The costs depend on the type of resources used to complete each task, along with the difficulty of reducing the task duration.
Similarly, the duration of some tasks can be reduced by many days, while others have only a small reduction available. "Task L (Approval)" normally takes one day, which cannot be reduced at all.
If we add up the cost of the normal task durations – for the baseline project plan – then we find that the normal project cost is $110,948.88 in total.
List of project paths
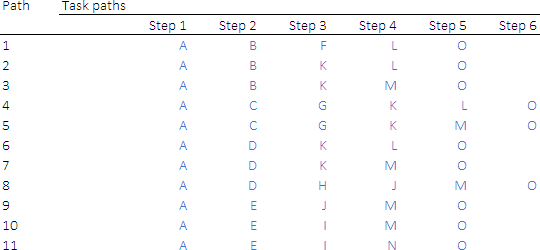
Figure 4 shows a list of all 11 paths for this project. In this project, all paths start and end with the same tasks ("A" and "O" respectively) – though that is not necessarily true in general.
The paths take five or six steps to proceed through the project plan. That is, each path includes up to 6 tasks.

Crashing decisions
Figure 5 shows the variables in our model, representing the project crashing decisions (number of days by which to reduce each task's duration).
Given the crash days, we can calculate the cost of that decision. Since the baseline project cost is fixed, in effect we are looking to minimize the sum of these crash costs.

Target project duration
We start with the baseline project duration of 65 days. Our objective is to reduce the project duration at minimum cost. But we can't just minimize cost, because the optimal solution would be to do zero project crashing, as that would incur zero cost.
Instead, we specify (as an assumption) a target project duration. Our objective is then to minimize the cost of achieving that duration.
Solver model
Objective function
The Solver model is shown in Figure 6. Our objective is to minimize fProjectCost.

Variables
The model has only one set of variables:
vCrashDays. The number of days by which to reduce the duration of each task.
Constraints
The constraints are:
fPathEnds <= dDuration. The duration of all paths must be no more than specified project duration.vCrashDays <= fCrashLimit. Upper bound on the number of days reduction for each task.
Solution method
Our model is a linear program that can be solved via either Solver or OpenSolver.
Analysis
Optimal solution
In most of our example models there is a clear optimal solution. Those models may have alternative optima – that is, solutions with the same, best objective function value. But we are, by definition, indifferent between the alternative optima, meaning that we are happy to accept any of them.

This model is different. We specify a target project duration, and the model finds a set of task crash durations that minimizes the cost of achieving that target duration.
By trial-and-error, we discover that the shortest possible project duration is 48 days. If we set the target project duration to 47 or fewer days, then the model is infeasible. That occurs because we're limited by the potential reduction in each task's duration.
Figure 7 shows all paths for an optimal solution in which we have a target project duration of 48 days. Some paths are significantly shorter than the target, and two paths – Path 5 and Path 11 – have durations of 48 days.
The revised project plan for a target of 48 days is shown in Figure 8. This project plan is, as intended, 17 days shorter than the baseline plan (indicated by the duration of the "Time reduction" task). To achieve this shorter duration, we incur an additional cost of $25,019.84 (+22.6% compared with the baseline project plan's cost).
The two critical paths are shown on the Gantt chart in red – both paths have a duration of 48 days.
When crashing a project, it is common for there to be multiple critical paths. That is a natural outcome of compressing the project plan. Beware that a crashed project plan, especially one with multiple critical paths, generally has higher risk than the baseline project plan. That is, a shorter project plan allows less opportunity to recover if one or more tasks takes longer than expected.
Time-cost trade-off
Our model does not know which target project duration is best – that is a decision to be made outside the model.
To inform that decision, we can find the optimal project plan for each possible duration. That is, from the shortest possible, 48 days, to the baseline duration of 65 days.
Figure 9 shows the trade-off between time (overall project duration) and cost (baseline plus additional resources).
The baseline duration of 65 days costs $110,948.88. Reducing the project duration by a few days incurs little additional cost, because the duration of some tasks can be reduced cheaply. But as the target duration gets shorter, the cost increases more rapidly. That occurs because we either need to incur very expensive crash costs for specific tasks, or we need to reduce multiple tasks simultaneously.
Provided sufficient budget is available, a potentially good trade-off is to reduce the project duration to 53 days. This reduction of 12 days (18.5%) incurs a $4,143 (3.7%) cost increase. Duration reductions to less than 53 days incur steep increases in cost.
Conclusion
This article demonstrates a project crashing optimization model. Manually crashing a project plan can be difficult. Using an optimization model, like this one, simplifies the process and ensures an optimal result given a project duration target.
If you would like to know more about this model, or you want help with your own models, then please contact us.
References
The model described in this article is based on the paper:
Li, K., Shao, B., & Zelbst, P. (2012). "Project crashing using Excel Solver: A simple AON network approach". International Journal of Management & Information Systems – Second Quarter 2012, Volume 16, Number 2, pp. 177-182.
